- Details
- Written by Alan McNicol
- Hits: 12644
Analysis of fibre distribution in a composite
Introduction
The distribution of fibres in a composite influences the mechanical properties of the material. An understanding of the distribution and how process variables influence it, is crucial in applications where those properties are essential for product safety or performance.
The Task
In this case images were captured across the complete cross section of a carbon fibre composite using a microscope with an automated XY-stage and an auto-focus system. While the ability to measure the whole area, rather than assuming smaller areas are representative of the whole, is a big advantage, the quality of the images obtained for analysis was not all that might be desired. In order to minimise the scan time, the magnification was set at a level that puts the fibre size close to detection limit (fibres 10 to 15 pixels in diameter), the lighting was uneven and the large difference in the reflectivity of the fibre ends and the matrix material made background subtraction a non-viable approach, the sharpness of the focus achieved was inconsistent both within images and between images, many fibre ends were damaged and no longer formed circles, the resultant debris from the damage was often present on the surface as well. This creates quite a challenging image analysis task compared to sharp SEM images with crisp circular fibre ends that can be simply detected.
Fibre position measurement
The usual approach is to use the Hough circles algorithm to find the fibre ends. In this case that produced nothing less than garbage. The final algorithm did the following:
- Flatten the lighting (based on a plane fit considering the brightness change with position of the fibre ends alone)
- Use an adaptive threshold to binarise the image
- Segment the image into individual fibres and matrix material by:
- using the binarised image to produce a marker image (erode, find particles, redraw each detected with a unique colour)
- use the marker image and the original binarised image with the watershed algorithm
- Identify segments that are too big/non-circular to be single fibre ends, erode those regions alone and reapply segmentation algorithm to them
- repeat until all segments pass test or have been fully eroded away.

This finds the position of the fibre ends reasonably reliably but the diameter of the fibre ends cannot be accurately assessed from the images in the initial set.
Analysis
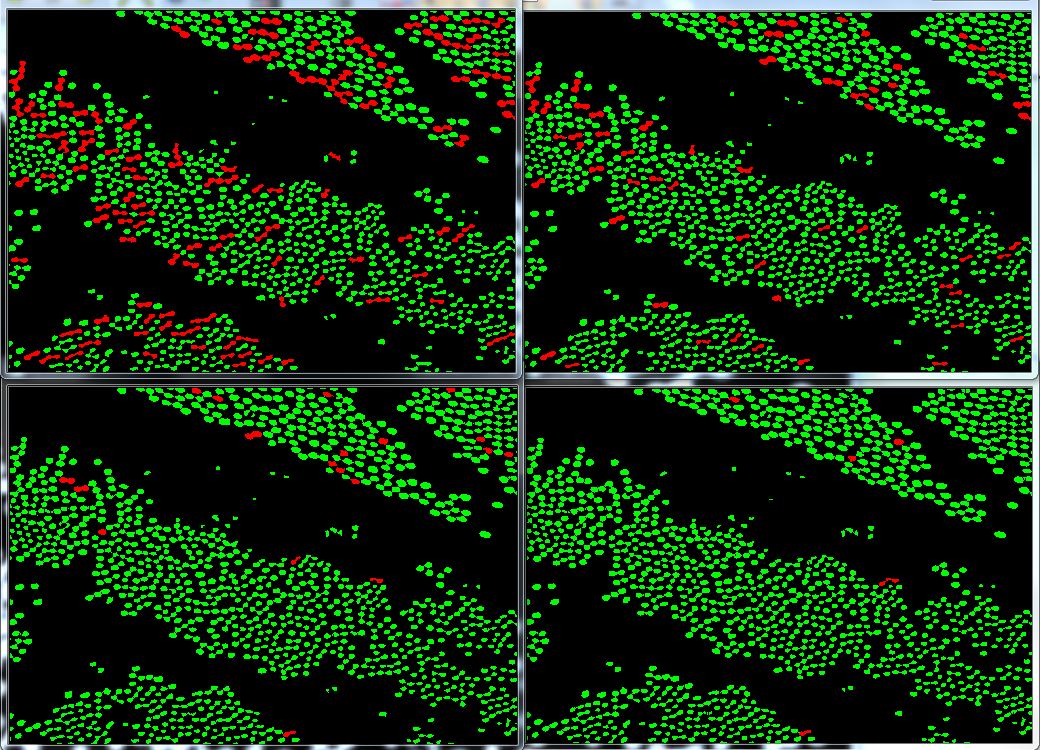
The next stage was to perform an analysis based on the positions gained. Voronoi regions were calculated. Each fibre sits within a Voronoi region, in the region within which that fibre is the nearest. This give polygonal regions with sides positioned half way between the region's own particle and other neighbouring particle. The distance to the nearest neighbour is simply 2x the distance between the particle and the nearest side of its Voronoi region. The distribution of the sizes of the Voronoi regions is also very useful. In a perfect hexagonally packed structure a histogram of the region areas would consist of a singe peak rather than a distribution. Real materials can show considerable variation in the size of their Voronoi regions.

This image illustrates how banding of fibre rich regions leads to large differences in the sizes of the (red) Voronoi regions. Also note the considerable voiding in the resin rich regions.
- Details
- Written by Alan McNicol
- Hits: 11763
Tribometer
The tribometer was specified with a motor/controller combination that offered a better than 1000:1 speed range along with a serial interface so that Stribek curves can be generated under computer control. The normal force is applied pneumatically and it would be trivial to apply computer control to this as well. The system is designed so that many sites can be multiplexed against heated rotating shafts and measurements made using very small volumes of oil. The design was patented and this currently held by ICI (now a subsidiary of Akzo Nobel).


- Details
- Written by Alan McNicol
- Hits: 11772
Bit from bytes 3D touch

This is a fused deposition type 3D printer. It has two extruder heads so it can print supports for more complex shapes or print two colour models. It has proven a very successful device for making parts for instruments:
Weight hangers and load cell holder
Various load hangers and load cell mounts for a tribometer.

Gear wheel microscopy jig
